


Stephanie Torres
Product Designer
Credly
AI - Badge Recommender
Scroll for
Case Study


Overview
Project
Badge Recommendations
Role
Product Manager, Design Lead
Year
2023
My role, as a Product Manager for the Earner Experience, was to help Credly connect individuals to opportunities. Credly's future success is dependent on engaging with individuals based on their verified skills/credentials.
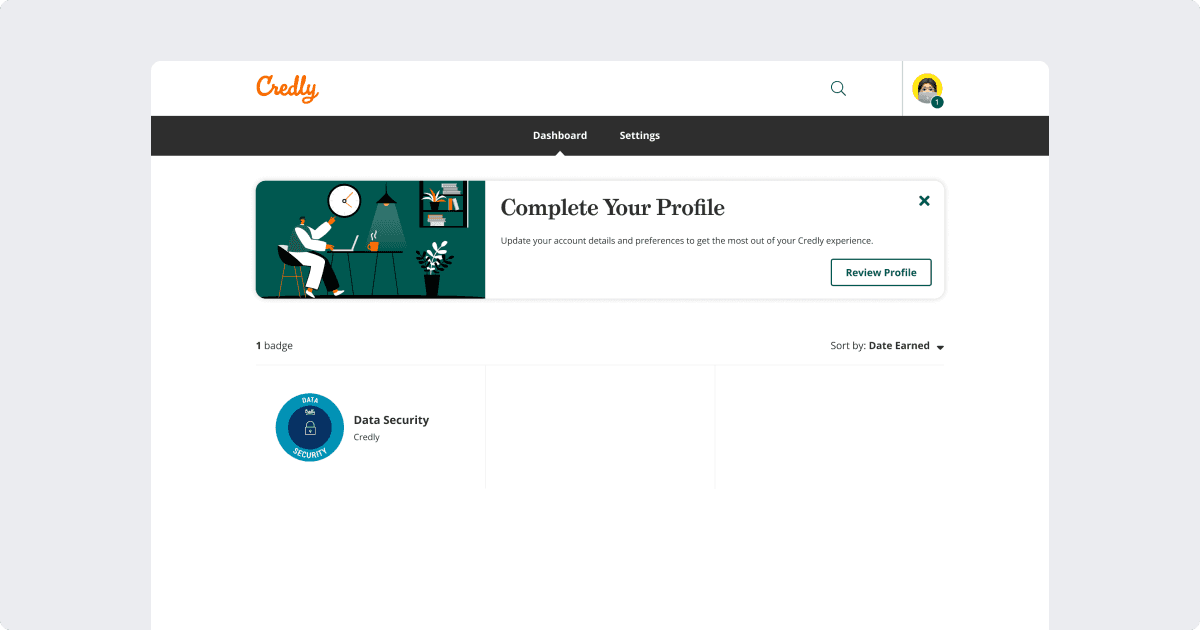
Upon joining Credly, the primary user flow was straightforward: users received an email, accepted their badge, and landed on a dashboard that functioned as a badge wallet. However, post-research revealed that users desired more: a comprehensive platform to showcase all their validated skills and learning.
Objective
To transform Credly's dashboard from a transactional experience into a personalized journey, connecting users to opportunities based on their verified skills and credentials.
"Opportunities" was broadly defined. At this stage, we hadn't yet had jobs to present to users. Using our existing content and capabilities, I knew we could first put our focus on helping users find their next badge to continue upskilling or reskilling. More learning transactions = growth for our learning partners.
Discovery
With 19 million users and ~2% providing minimal profile details including their current occupation. We didn't have sufficient data points about users to confidently map them to relevant badges.
This meant we first needed to capture more user data.
Identifying key data points
I had to identify the minimal amount of effort needed to power our badge recommendation algorithm. The essentials came down to ensuring we had the following data points:
Current occupation: A critical data point to understand and recommend popular learning paths for similar professionals.
Skill interests: Users needed to report at least 5 skills they were interested in learning from our skills ontology.
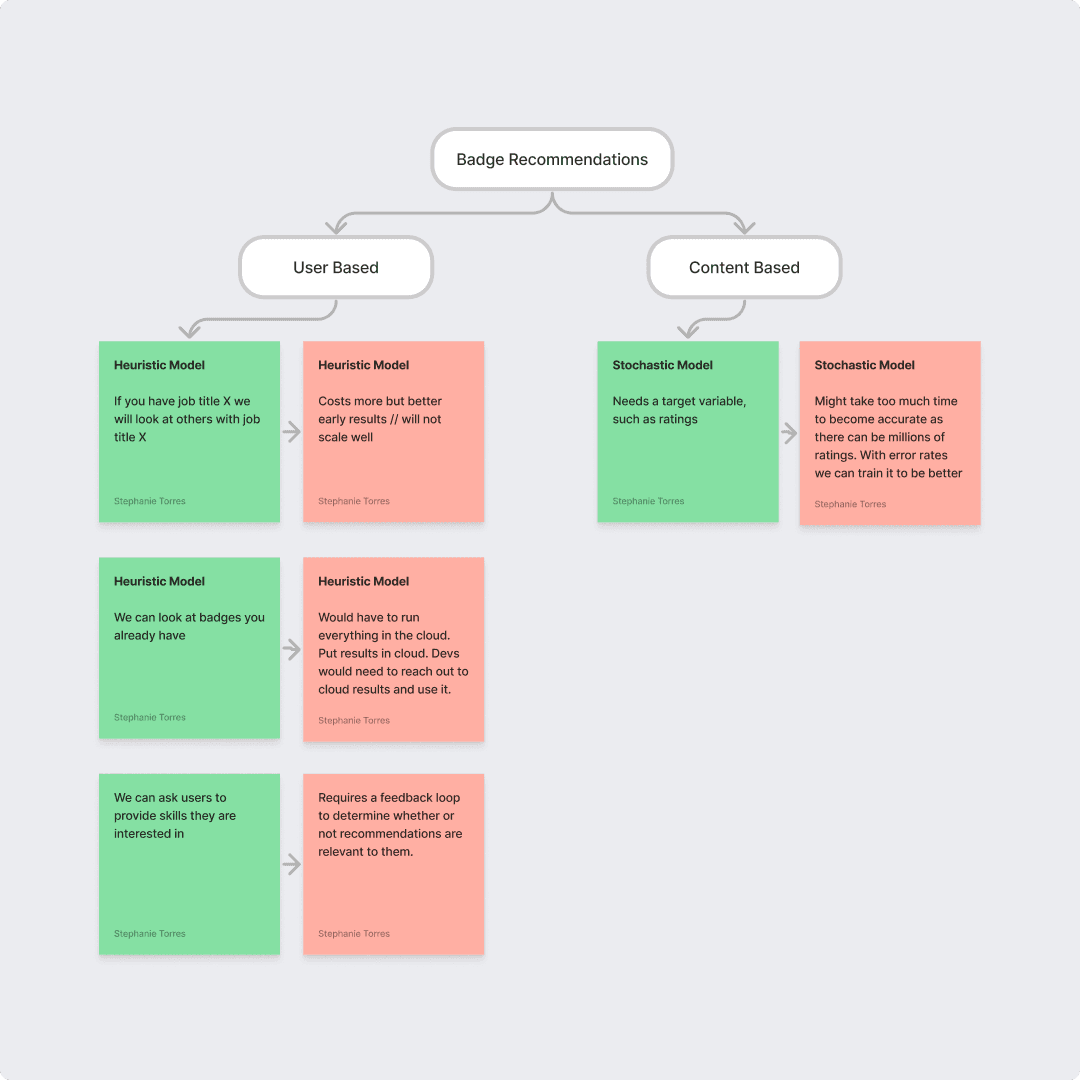
I explored both heuristic and stochastic models, weighing in the potential side effects of each solution. Settling for a simple solution to start with which was having users self-report details and run an algorithm to power what would be our first phase of recommendations.
Design & Iteration
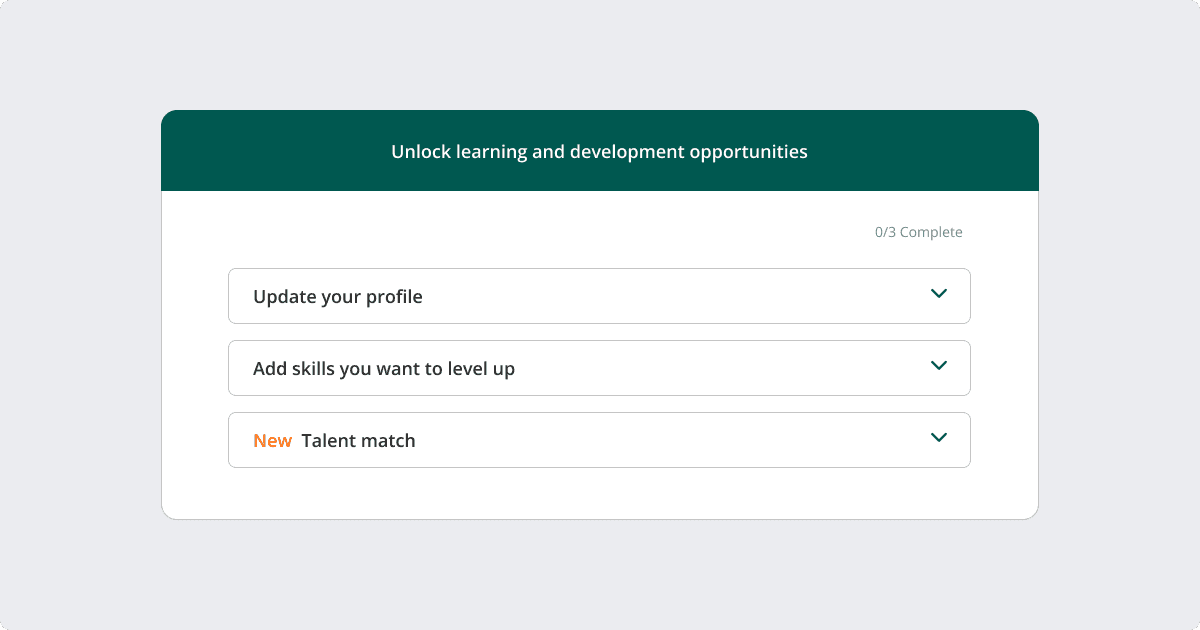
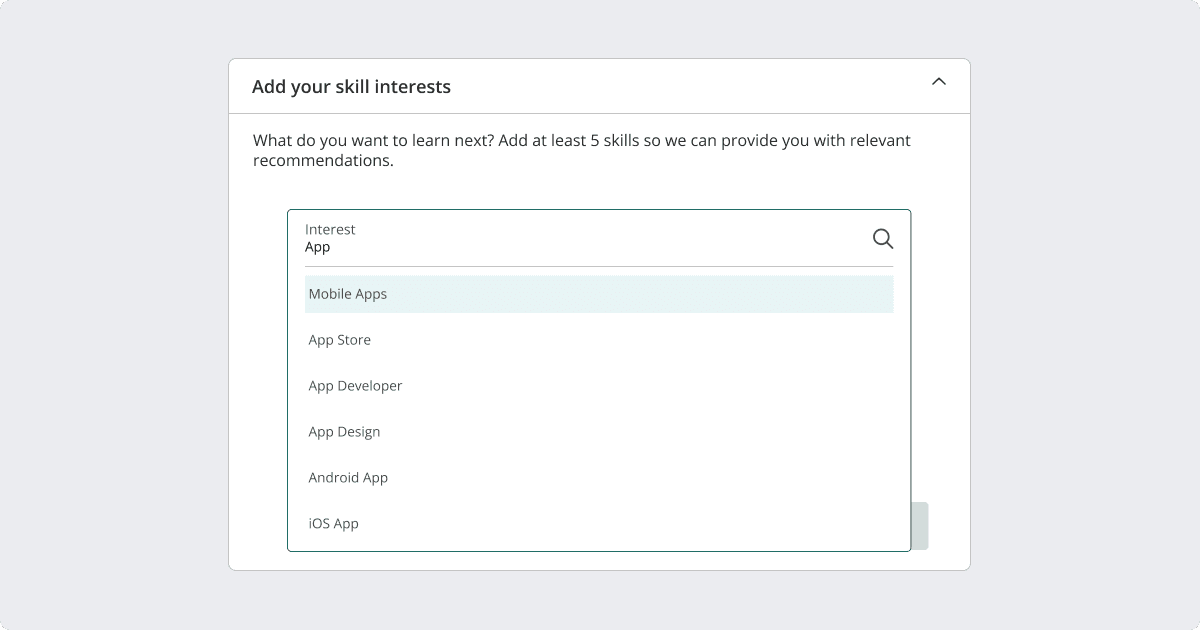
I implemented the data and skills interest capture form above on the dashboard to collect sufficient data about our users. A sprint later, we developed an initial recommendation algorithm to test our first set of learning recommendations.
function recommendBadges(user) {
    if (hasRequiredInfo(user)) {
        return combine(
            badgesBasedOnSkills(user),
            badgesFromOrgs(user),
            badgesForOccupation(user)
        );
    }
    return [];
}
Exploration of badge views
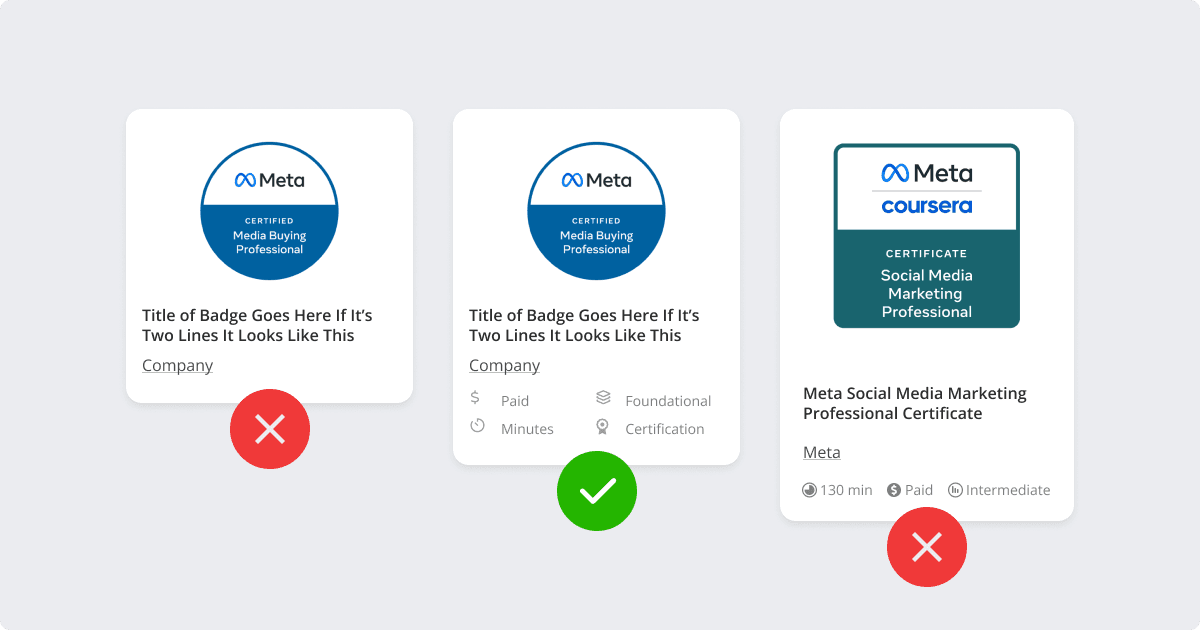
We experimented with various card views to showcase badge recommendations. Some of the styles we explored included:
Minimalist Cards: Focused on the badge image and title, keeping distractions to a minimum.
Detailed Cards: Provided more information, such as the badge attributes which included time to earn, free or paid, type of badge, and level of mastery.
We collected user feedback on the different card views to understand their preferences and pain points. This iterative process allowed us to refine our designs and ensure that the badge presentation resonated with our users.
By the end of this phase, we had a clearer understanding of how different badge presentations impacted user engagement. This set the stage for subsequent phases where we would further optimize the badge recommendation experience.
Outcome
Following our initial iterations on badge presentation, user feedback highlighted a recurring theme: users wanted clarity on the basis for badge recommendations. They sought to understand the rationale behind why certain badges were suggested to them and questioned the value of pursuing these badges.
Addressing User Concerns:
To address this, we took a two-pronged approach:
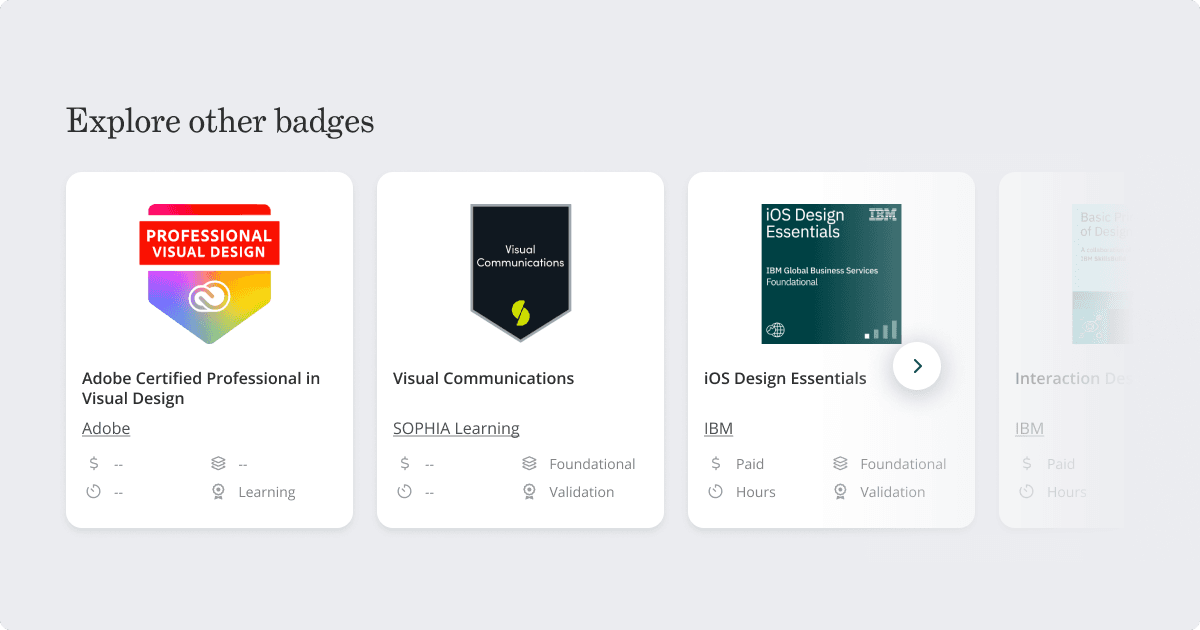
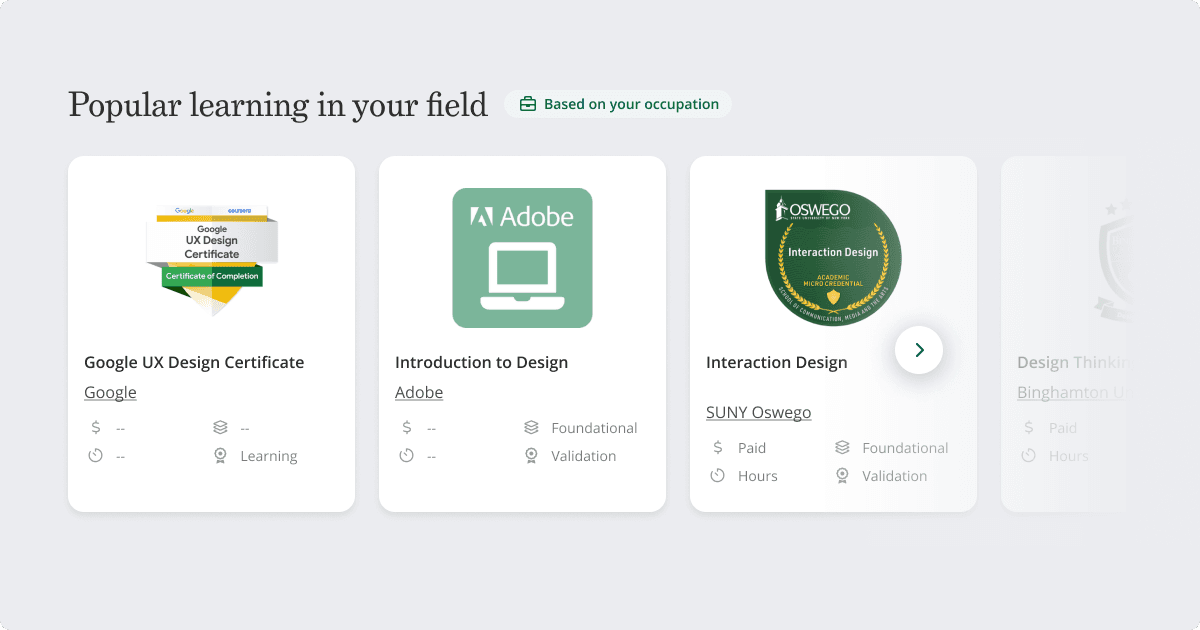
Clear badge section titles: We introduced distinct titles for each badge carousel section. This helped users immediately identify the criteria used for each set of badge recommendations. For instance, a section might be titled "Based on your skill interests" or "Popular in your occupation."
Informative Tags: We implemented tags throughout the platform, accompanying each badge. These tags provided quick insights into the basis of the recommendation. For example, a badge might have tags like "Based on your occupation" or "Based on your organization", etc. This not only clarified the recommendation logic but also reinforced the badge's relevance to the user.
Result:
On average, 11k users click on badges from recommenders each week.
From the 103k users who have clicked on the badges carousel on the dashboard, 9.58k have earned that badge after clicking. On average, the badge is earned 5.9 days later, which creates our caveat that it is possible many of these badges were already in progress for the earner.
Result:
On average, 11k users click on badges from recommenders each week.
From the 103k users who have clicked on the badges carousel on the dashboard, 9.58k have earned that badge after clicking. On average, the badge is earned 5.9 days later.
Stephanie Torres
Product Designer
Credly
AI - Badge Recommender
Scroll for
Case Study
Overview
Project
Badge Recommendations
Role
Product Manager, Design Lead
Year
2023
My role, as a Product Manager for the Earner Experience, was to help Credly connect individuals to opportunities. Credly's future success is dependent on engaging with individuals based on their verified skills/credentials.
Upon joining Credly, the primary user flow was straightforward: users received an email, accepted their badge, and landed on a dashboard that functioned as a badge wallet. However, post-research revealed that users desired more: a comprehensive platform to showcase all their validated skills and learning.
Objective
To transform Credly's dashboard from a transactional experience into a personalized journey, connecting users to opportunities based on their verified skills and credentials.
"Opportunities" was broadly defined. At this stage, we hadn't yet had jobs to present to users. Using our existing content and capabilities, I knew we could first put our focus on helping users find their next badge to continue upskilling or reskilling. More learning transactions = growth for our learning partners.
Discovery
With 19 million users and ~2% providing minimal profile details including their current occupation. We didn't have sufficient data points about users to confidently map them to relevant badges.
This meant we first needed to capture more user data.
Identifying key data points
I had to identify the minimal amount of effort needed to power our badge recommendation algorithm. The essentials came down to ensuring we had the following data points:
Current occupation: A critical data point to understand and recommend popular learning paths for similar professionals.
Skill interests: Users needed to report at least 5 skills they were interested in learning from our skills ontology.
I explored both heuristic and stochastic models, weighing in the potential side effects of each solution. Settling for a simple solution to start with which was having users self-report details and run an algorithm to power what would be our first phase of recommendations.
Design & Iteration
I implemented the data and skills interest capture form above on the dashboard to collect sufficient data about our users. A sprint later, we developed an initial recommendation algorithm to test our first set of learning recommendations.
function recommendBadges(user) {
    if (hasRequiredInfo(user)) {
        return combine(
            badgesBasedOnSkills(user),
            badgesFromOrgs(user),
            badgesForOccupation(user)
        );
    }
    return [];
}
Exploration of badge views
We experimented with various card views to showcase badge recommendations. Some of the styles we explored included:
Minimalist Cards: Focused on the badge image and title, keeping distractions to a minimum.
Detailed Cards: Provided more information, such as the badge attributes which included time to earn, free or paid, type of badge, and level of mastery.
We collected user feedback on the different card views to understand their preferences and pain points. This iterative process allowed us to refine our designs and ensure that the badge presentation resonated with our users.
By the end of this phase, we had a clearer understanding of how different badge presentations impacted user engagement. This set the stage for subsequent phases where we would further optimize the badge recommendation experience.
Outcome
Following our initial iterations on badge presentation, user feedback highlighted a recurring theme: users wanted clarity on the basis for badge recommendations. They sought to understand the rationale behind why certain badges were suggested to them and questioned the value of pursuing these badges.
Addressing User Concerns:
To address this, we took a two-pronged approach:
Clear badge section titles: We introduced distinct titles for each badge carousel section. This helped users immediately identify the criteria used for each set of badge recommendations. For instance, a section might be titled "Based on your skill interests" or "Popular in your occupation."
Informative Tags: We implemented tags throughout the platform, accompanying each badge. These tags provided quick insights into the basis of the recommendation. For example, a badge might have tags like "Based on your occupation" or "Based on your organization", etc. This not only clarified the recommendation logic but also reinforced the badge's relevance to the user.
Result:
On average, 11k users click on badges from recommenders each week.
From the 103k users who have clicked on the badges carousel on the dashboard, 9.58k have earned that badge after clicking. On average, the badge is earned 5.9 days later, which creates our caveat that it is possible many of these badges were already in progress for the earner.
Result:
On average, 11k users click on badges from recommenders each week.
From the 103k users who have clicked on the badges carousel on the dashboard, 9.58k have earned that badge after clicking. On average, the badge is earned 5.9 days later.